
Anwendungsbeispiele
Nachfolgend finden Sie eine Auswahl an Anwendungsbeispielen, die die Vielseitigkeit von Satellitendaten und die Leistungsfähigkeit unserer Dienstleistungen unterstreichen.

Einzelne Szenen
Finden Sie die passenden Satellitendaten für Ihr Projekt.

Photogrammetrische Bilddaten
Verwenden Sie orthorektifizierte Satellitendaten für Ihre Projekte.

Dokumentation von Naturereignissen
Erfassen und dokumentieren Sie Naturereignisse schnell und effizient.

Umweltmonitoring
Beobachten Sie kontinuierlich Umweltveränderungen, um frühzeitig auf potenzielle Risiken reagieren zu können.
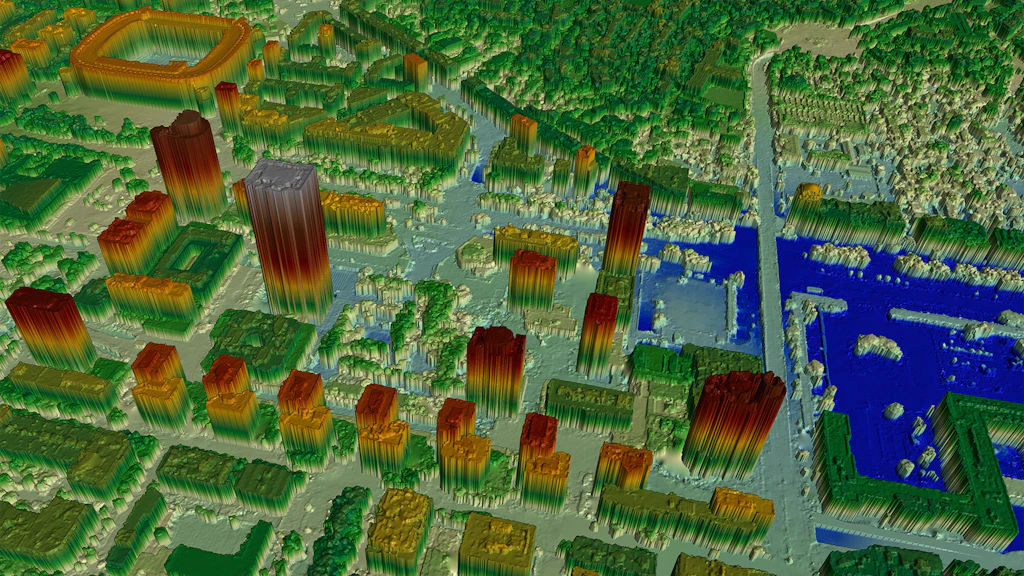
3D Daten
Nutzen Sie eine weitere Dimension in Ihrer Datenanalyse.

Zeitreihen
Beobachten Sie Veränderungen auf der Erde über verschiedene Zeiträume.