Emergency & Security
Satellite imagery nowadays is operationally and systematically employed when man-made or natural disasters strike. Their main advantage consists of almost instantaneous and area-wide acquisition of information, even over remote areas. Its usage though encompasses the complete disaster risk management cycle, i.e. from disaster respond over damage assessment to reconstruction activities. Often, satellite imagery acquired over disaster areas is complemented by higher resolution aerial imagery in order to obtain more detailed information about damages.
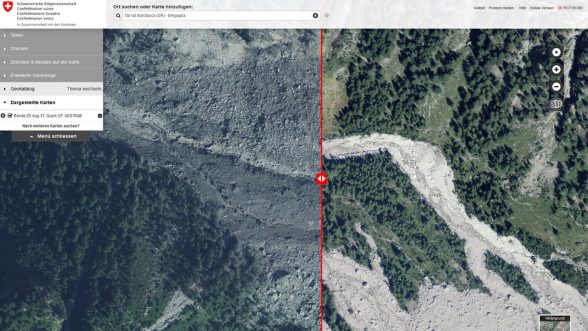
Rapid Mapping
Satellite data are of central importance alongside aerial photographs as part of the federal government's service for the timely collection and provision of geodata for event management and documentation in the event of natural events - known as Rapid Mapping. In this context, the responsible agencies at all federal levels (Confederation, cantons, municipalities) are actively supported in assessing and documenting the effects of natural events.
The International Charter Space and Major Disasters
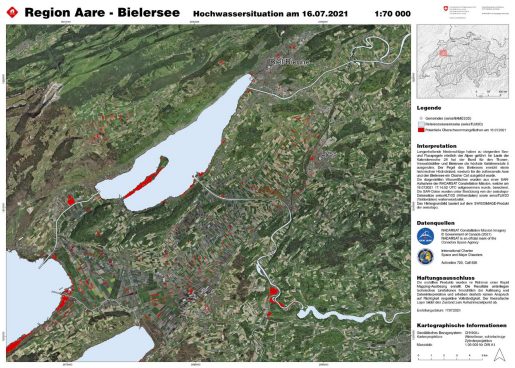
The International Charter is a mechanism put into place by a number of Space Agencies producing Satellite Imagery. It aims at providing a unified system of space data acquisition and delivery to those affected by natural or man-made disasters through Authorized Users. Since spring 2021, swisstopo/NPOC perceives the role of Authorised User for Switzerland and thus, coordinates image acquisition and analysis in case of a disaster over Switzerland.
At the request of the Federal Office for the Enviroment (FOEN), swisstopo NPOC activated the International Charter Space and Major Disaster in July 2021 to provide satellite images in response to the heavy rainfall in the region of Lake of Biel. Within this Carter activation (Activation ID 720) the NPOC coordinated, as Project Manager, the image acquisition of optical and SAR data and performed, as Value Adder Provider, the assessment of the flooded areas. It was the second Swiss activation in the history of the International Charter after 2005, when extensive rainfalls caused severe flooding and landslides in Berne, Lucerne and adjacent cantons.
Land displacement monitoring
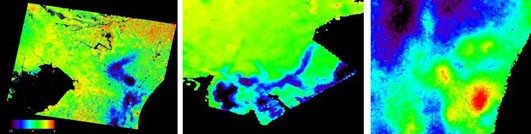
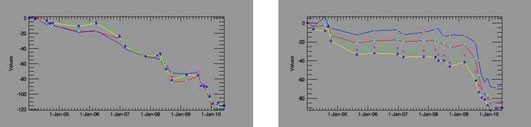
Small terrain displacements can be detected and monitored over long time periods exploiting interferometric stacking techniques based on Synthetic Aperture Radar (SAR) data obtained from spaceborne platforms. Operational terrain displacement maps with proven accuracies on the order of one mm/year, from which average displacement rates can be obtained.
The Federal Office of Topography swisstopo procures and distributes processed InSAR data of the entire perimeter of Switzerland. As a data basis for this Switzerland-wide monitoring of surface movement, the data of the Sentinel-1 SAR satellite constellation will be processed and, at the beginning of 2022, published and distributed by swisstopo as a freely available geodata set (OGD).